Neelay RanjanGenerative modeling for domains where labels are scarce and mistakes are expensive.

NASA Ames Research Center · Regenstrief Institute · Purdue University

I build generative models for domains where labeled data is scarce and a wrong prediction costs more than a missed one. My first-author paper on label-efficient vessel segmentation from catheter angiograms is in preparation. At NASA Ames I work on airspace coordination and a synthetic dataset for air traffic control speech; at Regenstrief I trained the diffusion model behind that paper. I also built a 553 KB chess engine; you can play it further down this page. I'm on a gap semester from my AI degree at Purdue, applying to master's programs for fall 2027.

Table 1. The headline numbers from the paper below, and the chess engine running in your browser.
0.882Dice at 16 labeled angiograms, from my paper in preparation
25/25paired runs ahead of every baseline
~75%faster surgeon corrections, measured
553 KBchess engine, roughly 1900–2200 Elo, in your browser

Research

My first-author paper, “Bootstrapping surgeon labeling campaigns with x0-diffusion: label-efficient vessel segmentation of catheter-based angiograms,” is in preparation (with Shantanu Dev and Andrew Gonzalez at Regenstrief Institute). I trained a diffusion model to predict the clean segmentation mask directly instead of predicting the noise, so it reaches 0.882 Dice from 16 labels, ahead of five baselines in 25 of 25 paired runs.

The same model made a surgeon ~75% faster at correcting its output, measured rather than estimated. The claim is label efficiency, not peak accuracy: a few baselines eventually reach comparable Dice too, once they see far more than 16 labels.

labels 16
0.40.50.60.70.80.91.0163280labeled training angiogramsmean test Dicex0-diffusionSAM (zero-shot)ViT-B/16hybrid ResNet+ViTResNet-UNetDeepLabV3

x axis is log-spaced. budgets 16 (5%), 32 (10%) and 80 (25%) labels of the 320 training images.

mean dice at 16 labels, ±1 std devx0-diffusion 0.882 ±0.068SAM (zero-shot) 0.835 ±0.148ViT-B/16 0.791 ±0.131hybrid ResNet+ViT 0.749 ±0.185ResNet-UNet 0.703 ±0.182DeepLabV3 0.657 ±0.202

x0-diffusion leads the closest baseline, SAM (zero-shot), by 0.047 dice.
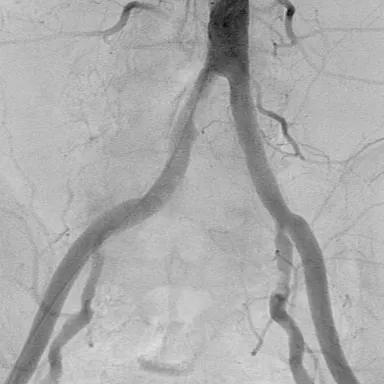
Pelvic-iliac angiogram from the segmentation benchmark, test image 333
angiogram
test image 333
x0-diffusion
Dice 0.928
SAM (zero-shot)
Dice 0.842
ResNet-UNet
Dice 0.418

masks: the seed-1, fold-1 run at 16 labels. dice computed from the shown pixels.

Figure 1. The graph behind the headline number. Each point is one model’s mean test Dice at one label budget, pooled over every seed and fold, 2,500 predictions per point; whiskers mark one standard deviation at the budget the slider selects. At 16 labeled angiograms x0-diffusion sits at 0.882 and the nearest baseline is SAM at 0.835, which is zero-shot and never trains on labels, so its line is flat. Slide right and the trained baselines climb: DeepLabV3 catches up at 32 labels, and by 80 it and ResNet-UNet edge ahead. That crossover is the claim, label efficiency rather than peak accuracy. One baseline is left off the axes: ε-diffusion, the same architecture trained to predict the noise instead of the clean mask, sits near 0.23 Dice at every budget, and keeping its line squashed the range where the differences live. Under the chart, one real test angiogram with each model’s mask at the selected budget: at 16 labels ResNet-UNet returns noise on it and by 80 it has caught up, SAM’s single zero-shot mask never changes, and x0-diffusion barely moves. Each panel prints the Dice computed from the exact pixels it paints.
dice 0.30
0%5%10%15%20%25%30%0.00.20.40.60.81.0per-image test Dicecumulative share of predictions0.5x0-diffusionSAM (zero-shot)ResNet-UNet

y axis clipped at 30%. the tail is the whole finding.
share below 0.30 dicex0-diffusion 0.20%SAM (zero-shot) 0.84%ResNet-UNet 4.20%
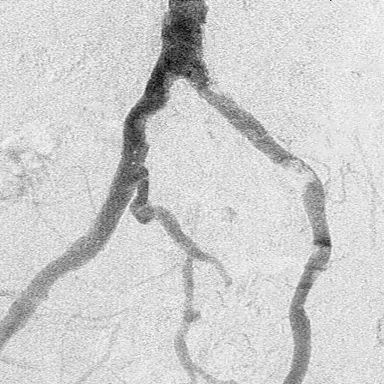
Pelvic-iliac angiogram from the segmentation benchmark, test image 196
angiogram
test image 196
x0-diffusion
Dice 0.939
SAM (zero-shot)
Dice 0.463
ResNet-UNet
Dice 0.759

curve: every test prediction at 16 labels, 2500 rows per model. panels: the seed-1, fold-1 re-run of that same budget, dice computed from the shown pixels.

Figure 2. The distribution behind the mean. Every per-image test Dice at the 16-label budget, pooled over all seeds and folds, so each line is 2,500 predictions: read up from a Dice value and you get the share of predictions that scored below it. The y axis is clipped at 30% because the failure tail is the part worth seeing. At the thin reference line, 0.5 Dice, x0-diffusion (solid green) has put 0.32% of its predictions, SAM (dashed red) 5.4%, and ResNet-UNet (dotted amber) 13.5%. x0-diffusion’s mean is a few points ahead of the baselines; what it almost never does is fail outright. Move the slider to pan the cursor along the Dice axis and the readouts give each model’s exact share below it. Under the chart, one real test image per stop with all three models’ masks over it, drawn from a re-run of the paper’s seed-1 runs that covers all 100 test images, so each stop lands on an image whose SAM Dice sits near the cursor, real failures included. Every panel prints the Dice computed from the pixels it paints, against the benchmark’s ground truth for that image. The trained models reproduce their recorded runs from those pixels, ResNet-UNet to the fourth decimal; SAM’s inference is stochastic, so its masks here are a fresh draw that can score off its recorded row, and the number shown is the one the shown pixels earn.

I also led the PCB design team for a helical antenna for electromagnetic field stimulation in Alzheimer’s disease therapy; we presented it as an oral at IEEE MWSCAS 2026 in Cincinnati on August 11.

F. Perez, J. Morisaki, H. Kanakri, M. Rizkalla, et al. (incl. N. Ranjan), “Helical Antenna for Electromagnetic Field Stimulation in Alzheimer’s Disease Therapy,” IEEE MWSCAS 2026 (oral).

My NASA Ames work is two engagements: SLAAC, space-launch and airspace coordination, with Dr. Kapil Sheth in summer 2026, and a synthetic text-to-speech-to-database pipeline for air traffic control speech with Stephen Clarke this fall. The SLAAC poster's numbers: 98–99% clear the 25 nm buffer, +1.1% median added distance at infinite lookahead, and within 1.2% of geometric optimum.

Figure 3. A transformer I trained from scratch on its own flight-plan vocabulary, writing a full day of FAA flight plans: roughly 44,000 flights, matched to the density of a real day of traffic. Its output feeds NASA capacity and safety studies of US airspace failure modes. Every path in this clip is synthetic; none of it is recorded ATC data.

Live systems

Both demos below run their real trained weights in your browser. Nothing here is a recording or a mockup.

Experience

2026NASA Ames Research CenterSLAAC airspace coordination and a synthetic ATC speech pipeline.active
2024 to presentRegenstrief Institutex0-diffusion vessel segmentation and a synthetic angiogram pipeline, with Shantanu Dev and Dr. Andrew Gonzalez.active
expected May 2027Purdue UniversityB.S. in Artificial Intelligence, Intelligent Control & Systems concentration, math minor. John Martinson Honors College, Dean’s List, 3.68 GPA.gap semester
2026Alzheimer’s stimulation antennaLed the embedded and PCB team on a helical antenna for electromagnetic field stimulation; presented as an oral at IEEE MWSCAS 2026.complete
2025Davinci WearablesAn agentic vision pipeline that estimates nutrition from meal photos, under 15% error.complete
2024–2025V2X aircraft-maintenance LLMLed the two-stage RAG design; cut hallucinations from about 40% to about 5%.complete
Figure 6. Five roles since 2024 and my degree, current work first. The lamp is real state, not decoration: green means active now, and amber means paused until January.

References

  1. Bootstrapping surgeon labeling campaigns with x0-diffusion (in preparation)
  2. F. Perez, J. Morisaki, H. Kanakri, M. Rizkalla, et al. (incl. N. Ranjan), “Helical Antenna for Electromagnetic Field Stimulation in Alzheimer’s Disease Therapy,” IEEE MWSCAS 2026 (oral)
  3. Resume
  4. GitHub
  5. ORCID
  6. LinkedIn
  7. Email
  8. Supplementary material

The sky behind this page is a real chart of the sky over NASA Ames.

The sky over NASA Ames from the moment you arrived. The shapes are enlarged and coloured as long exposures show them, but every position is real.